The Environmental Sensitivity Mapping tool
Drawing on skills from Alluvium Consulting, EcoFutures and Mosaic Insights we worked with South East Water and Discover EI to develop an innovative tool to enable South East Water to identify environmental sensitivities within its service area and proactively manage its duty of care for the environment.
In a water industry first, the Environmental Sensitivity Map locates key environmental habitats for endangered species and critical vegetation and helps determine the vulnerability of local waterways and wetlands.
Initially, the map was developed to serve as an incident response tool. It has now grown to assist South East Water with strategic environmental planning, assessments and regulatory requirements, providing an important baseline of understanding for areas of environmental significance within its service area.
The Environmental Sensitivity Map offers insights for 26 sensitivity categories across local waterways, terrestrial, coastal and marine environments. Users can type an address into the map to get real-time information about sensitivities in the surrounding environment with colouring to indicate a 1-5 sensitivity rating.
South East Water General Manager Liveable Water Solutions, Charlie Littlefair said the map created an important awareness of environmental sensitivities in the field.
“We have a duty of care to be proactive stewards of the natural environment in which we operate to minimise risk of harm, pollution or degradation.”
“The Environmental Sensitivity Map allows us to see in real-time what is on our doorstep, and what kind of risk management is required to protect the environment in which we’re operating.
“This innovative tool is leading our commitment to achieving responsible outcomes for our environment, customers and community.”
“We look forward to using the tool further to promote biodiversity and environmental improvements in our operations and future capital projects.”
The drivers and project aims
There is an increasing demand for reporting tools that make environmental datasets accessible to decision makers. The abundance of environmental datasets can be overwhelming when trying to build an evidence-base for managing environmental risk, and making informed decisions about strategies that ensure effective use of resources for environmental protection. Environmental datasets are often located on different portals; they are delivered in different formats, updated at different frequencies, and are not necessarily reported in a way managers can use.
The consequence of all this is that environmental data are under-utilised in decisions regarding the protection of environmental values and managing risks. In this project we worked with South East Water to address this gap.
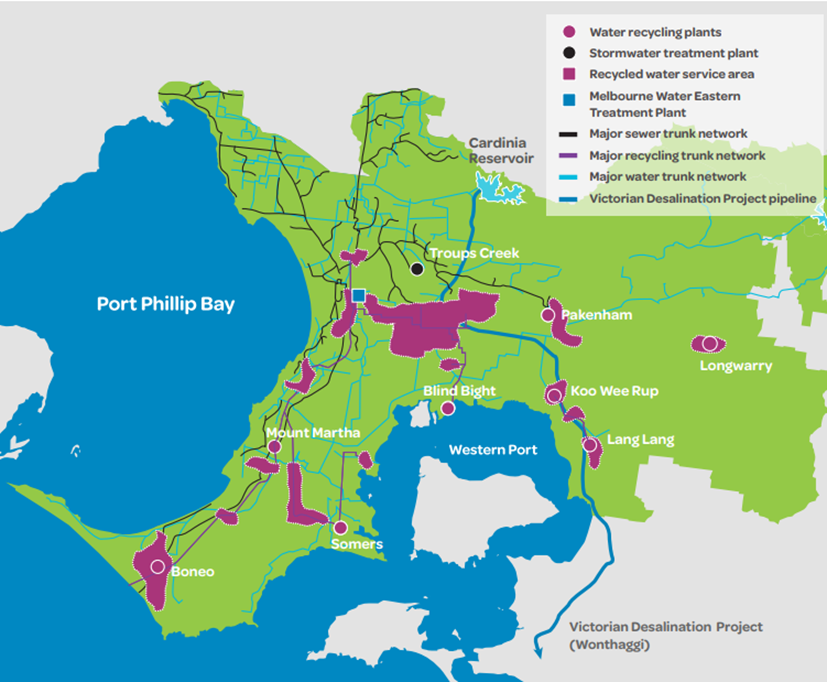
South East Water provides essential sewer services across a land area of 3,640 km and owns more than 25,700 kilometres of pipeline across metropolitan Melbourne. It maintains $4.9 billion worth of assets and networks and collects more than 136 billion litres of wastewater at numerous water recycling plants every year. These assets provide essential services for Melbourne’s population.

Figure 2. Water infrastructure owned by South East Water
However, they can also impact the natural environment in which they are situated if these assets were to fail. Understanding what environmental values, where they exist within the South East Water operating boundary and the level of significance of these environmental values is crucial in evaluating environmental impacts and consequences during a sewerage asset failure incident. Furthermore, as part of ongoing strategic planning and development of monitoring activities there is a need to strengthen understanding of existing environmental values and their sensitivity towards these assets.
To address these emerging needs and opportunities, we worked with South East Water to identify, consolidate and review existing data to provide a framework and data architecture to map environmental sensitivity within the water utility’s operating boundary. These formed the basis for developing a mapping data dashboard that can be used across different groups at South East Water for incident reporting and strategic planning. Discover EI were engaged in the final design of the dashboard, to help ensure the tool leveraged the full functionality of Power BI, which was South East Water’s preferred platform for mapping and reporting.
The solution – Drawing on skills from Alluvium Consulting, EcoFutures and Mosaic Insights we brought together environmental expertise and data scientists to develop a fit-for-purpose tool
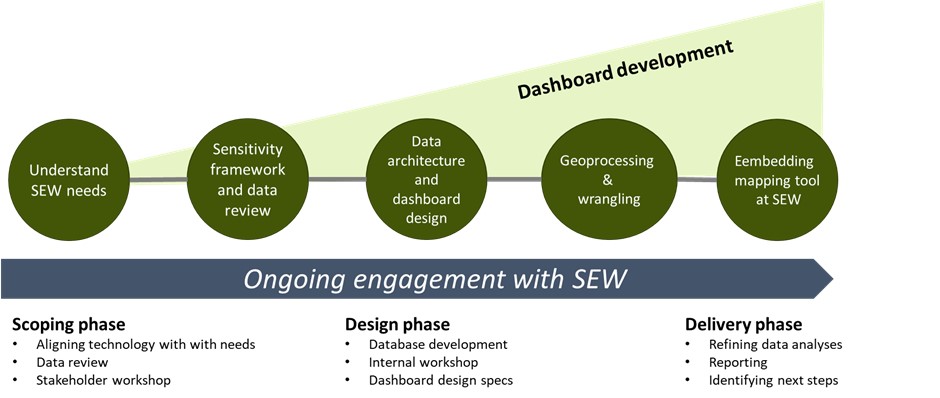
A carefully designed engagement strategy was key to the success of the project. The enthusiasm and interest in the project amongst end-user groups at South East Water provided a great starting point for engagement. We held workshops with these end user groups, together with environmental experts and ecologists from Alluvium Consulting Australia and EcoFutures Consulting. Our data scientists at Mosaic Insights also explored opportunities, and gathered information needed to develop the design specifications for the mapping tool. The workshops were led by one of our experienced facilitators, which helped the conversation converge towards a solution that compasses data science, ecological principles, analytical tools, data visualisation, and most critically, the diverse needs amongst potential user groups.

Figure 3. Engagement needs to start early ideally before developing a dashboard.
Some design criteria that emerged from the workshops include:
- Metrics to be developed from a consistent and accepted sensitivity framework.
- A mapping tool that is intuitive to use and which can be used to explore spatial data without experience with GIS software.
- Robust and repeatable data processing workflows for updating environmental mapping products with the most recent data.
- Navigation tools and structures that allow for information to serve different functions, including incident response, strategic planning, and reporting.
- Hierarchical data structure that allows users to obtain overview of environmental sensitivity but also to drill down into detail on specific environmental assets if needed.
- Effective visuals to assist users to identify components quickly.
The dashboard
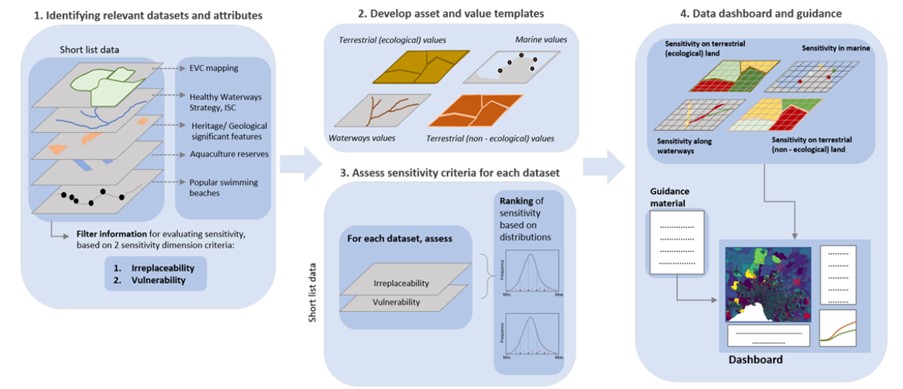
The Environmental Sensitivity Map offers insights for 26 sensitivity categories across waterways, terrestrial, coastal and marine environments. Users can type an address into the map to get real-time information about sensitivities in the surrounding environment with colouring to indicate a 1-5 sensitivity rating. The sensitivity is mapped in grid cells which are cross-referenced with data tables which contain inventories of the environmental values contained within each cell. This structure means a user can view colour-coded sensitivities in the mapping interface for different environmental values, whilst pulling up tables on species, habitats, and their conservation status at the same instance.
We applied a consistent sensitivity framework to all environmental datasets. This enabled us to systematically assess each environmental values (or assets) in terms of:
- Irreplaceability depicts asset’s rarity. This is a function of current environmental and socioeconomic conditions, extent to which the loss of the area or species will compromise regional targets,
- Vulnerability combines the function of asset’s current ecological health, resilience (or lack of resilience), protection and trajectory. The breadth of options available over time to conserve a given biodiversity feature before it is lost.

Figure 4. Data architecture embedded in the environmental sensitivity mapping tool.
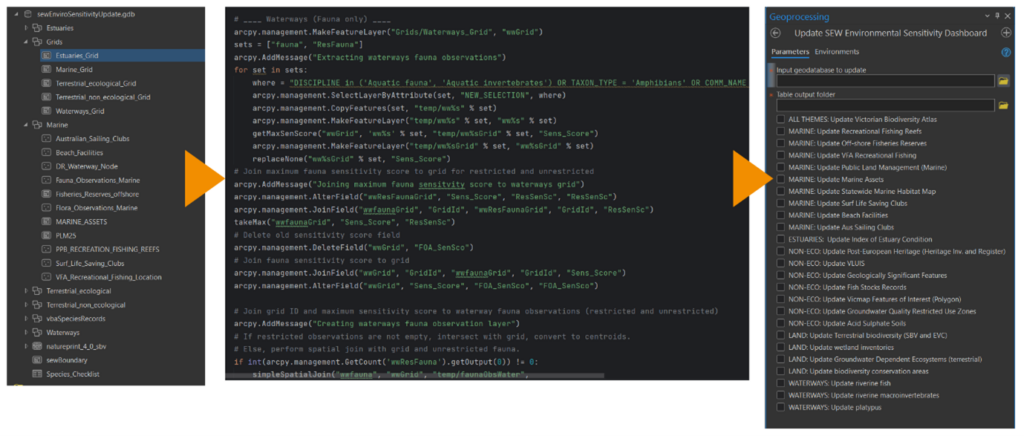
The functionality within the final Power BI dashboard was enhanced with input from Discover EI who specialises in the development of these type of dashboards. A key feature of the dashboard is the data structures linking sensitivity mapping with the detailed information on environmental assets that make up the sensitivity. Data scientists at the Alluvium Group are currently building automated workflows for processing environmental datasets and generating sensitivity mapping products that integrates seamlessly with the dashboard. This means that the dashboard can be updated with new data regularly with minimal effort. This feature is particularly important for some datasets such as threatened species observations listed under the Environment Protection and Biodiversity Conservation (EPBC) Act 1999 and Flora and Fauna Guarantee Act 1988 which are frequently updated.

Figure 5. Disparate, unprocessed spatial datasets are stored in a geodatabase, the update operations to integrate the datasets into the dashboard are coded in Python, then embedded into an easy-to-use geoprocessing script tool within ArcGIS.


